
Multiwavelength View of the Close-by GRB190829A Sheds Light on Gamma-Ray Burst Physics
by Om Sharan Salafia (INAF – Osservatorio Astronomico di Brera and INFN, Italy)
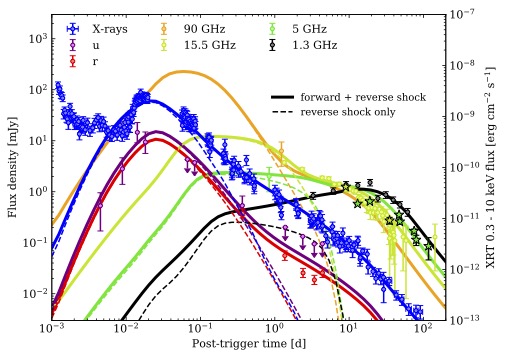
different frequencies. Circles with error bars represent the flux density
measured from observations of GRB190829A at different frequencies
(as detailed in the legend) and times (shown in days after the start of
the gamma-ray emission on the horizontal axis). Downward-pointing
arrows mark upper limits. Stars are the flux densities obtained from
our EVN and VLBA observations. The solid lines represent our best-fitting
model. The dashed lines single out the contribution of the reverse shock.
Gamma-ray bursts have been serendipitously discovered in the late 1960’s (see Klebesadel et al. 1973 and Weekes 1999 about the initial discovery, and Kumar and Zhang 2015 for a recent review), but our understanding of the underlying physical processes is still far from complete. We have solid evidence that the main ingredient is a relativistic jet, that is, a narrow surge of plasma that travels almost at the speed of light. The short duration (seconds to minutes, rarely hours) and extremely large energy of these jets points to the central ‘engine’ (the place where these jets are born) being a black hole or a neutron star. Indeed, some supernovae have been identified (the first being SN1998bw, see Galama et al. 1998) in association to gamma-ray bursts, which clearly indicates that these formed following the core-collapse of a massive star – which is known to lead to the formation of a black hole or a neutron star. When the fast and energetic jet material expands into the interstellar medium, it drives a shock wave that propagates outwards, which is referred to as the ‘forward shock’. Soon the energy of the swept-up material, as seen in the rest frame of the jet, becomes comparable to the rest mass energy of the jet itself: the latter then starts to decelerate significantly because of energy and momentum conservation. The deceleration starts off in the outermost layers of the jet, but this leads to a supersonic collision with the layers behind (which have not slowed down yet): this produces a second shock wave, called the ‘reverse shock’. Both shocks are thought to be places of particle acceleration (through the ‘Fermi process’, Fermi 1949, which is realised in what is known as ‘diffusive shock acceleration’, e.g. Bell 1978). The accelerated particles radiate their excess energy by a number of processes, including Synchrotron (particles radiate as they interact with the magnetic field present in the plasma, which is thought to be amplified by the shock itself) and inverse Compton (photons are scattered off the relativistic particles, gaining energy). In suitable conditions, the main source of seed photons for the inverse Compton process is the synchrotron radiation from the particles themselves, which leads to what is called ‘synchrotron-self-Compton’.
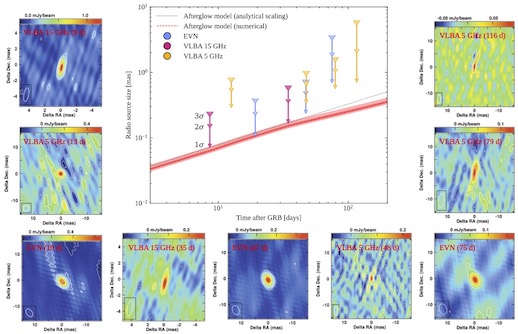
high-resolution EVN and VLBA imaging. The downward arrows in the main
panel show the projected size constraints (in milliarcseconds, each
relative to the observation time shown on the horizontal axis) obtained
from our EVN (blue) and VLBA (purple and orange) observations. Each has
three arrowheads, corresponding to three levels of confidence that the
true size should lie below (1σ = 68%, 2σ = 95%, 3σ = 99.7%). The dotted
and dashed lines represent the size entailed by our best-fitting model
(as computed through two different techniques), with the band showing
the associated uncertainty. The smaller panels show the images of the
sources obtained from the data of each observing epoch.
Summing up, the forward and reverse shocks that form as the jet is decelerated by the interstellar medium are sources of radiation, which stems from the acceleration of particles and amplification of magnetic field at the shocks and from the consequent radiation through the synchrotron and synchrotron-self-Compton processes. All of this is usually referred to as the gamma-ray burst afterglow, because this emission happens after the gamma-ray burst, and it evolves on a slower time scale. The whole process is rather complicated, but mathematical models exist which can be used to compute the expected behaviour (luminosity, spectrum, evolution) of the radiation as a function of the underlying physical conditions (the jet total energy, its opening angle, the interstellar medium density, the details of the particle acceleration at the shock).
The gamma-ray burst GRB190829A represented a fantastic test-bed for this kind of physics. Discovered by the Fermi satellite on 29 August 2019, it was observed by an impressive number of facilities over the entire electromagnetic spectrum. Letting aside the initial gamma-ray data by the Fermi satellite, the subsequent observations span more than five orders of magnitude in time (from 10-3 days – i.e. ~100 sec – to more than 100 days after the initial gamma rays) and 18 orders of magnitude in frequency (from the radio at ~1 GHz to the very-high-energy observations around photon energies of 1 TeV – i.e. ~1027 Hz). Each observation permitted the measurement of the brightness (‘flux density’) of the source at the relevant time and frequency, as summarised in Figure 1.
The very-high-energy observations, performed by the High Energy Stereoscopic System (HESS), attracted particular attention: only a handful of gamma-ray bursts had been detected at such frequencies before. A debate about the interpretation of the HESS data took place in the scientific literature. The HESS Collaboration published an article (HESS Collaboration 2021) suggesting that this emission was synchrotron from the forward shock, despite this requires the particle acceleration process to be capable of producing particles faster than physically possible in the standard theory (see e.g. Miceli and Nava 2022).
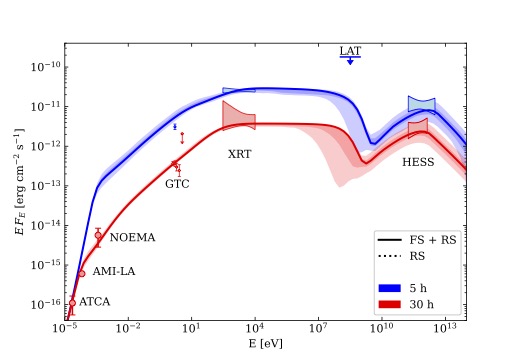
extending to comprise the very-high-energy HESS observations. Circles
with error bars and butterfly-shaped symbols represent measurements of
the photon energy E times the flux density FE (E×FE) of the GRB190829A
afterglow at 5 hours (blue) and 30 hours (red) after the start of the
gamma-ray emission. The solid lines represent our best-fitting model,
with the bump at large E being produced by synchrotron-self-Compton
radiation. The shaded bands represent the uncertainty on the model
(see the article for more details).
In the meantime, we performed high-resolution observations of the source with the European VLBI Network (EVN) and the Very Long Baseline Array (VLBA), gathered radio, Optical and X-ray data from the literature, and re-analyzed some of the publicly available gamma-ray, X-ray and Ultraviolet data. Armed with such a rich dataset, we delved into its analysis and interpretation. We carefully analysed the EVN and VLBA data, which led to meaningful constraints on the size of the forward shock at the time of our observations (see Figure 2). We were able to self-consistently interpret all these observations with a model that includes emission from both the forward and reverse shocks (the model is shown by solid lines in Figure 1), whose synchrotron-self-Compton emission is also in agreement with the HESS observations (in contrast with the claims by the HESS Collaboration – Figure 3), and whose forward shock projected size is compatible with the EVN and VLBA constraints (Figure 2). The success of the model requires a ‘special effect’: the magnetic field generated by the reverse shock must decay rapidly after the shock crosses the jet, which is reasonable[1] but not entirely settled, and thus sheds light on a poorly understood part of the physics involved.
[1] The magnetic field amplification is thought to be mediated by small-scale turbulence, which arises during the propagation of the shock. As soon as the shock crosses the jet, it disappears, and hence the turbulence decays, see e.g. Chang et al. 2008 and Inoue et al. 2011. How fast this happens, and its effect on the emission, are still matter of active research.
Published in Salafia et al 2022 ApJL 931 L19