Extragalactic research based on new-generation geodetic data
Víctor Pérez-Díez
The linear polarization basis is preferably used in new-generation radio interferometers. The main reason is the wide instantaneous fractional bandwidths that can be achieved with a minimum instrumental polarization. This is the case of the VLBI Global Observing System (VGOS), the next-generation geodetic VLBI system. In order to achieve the goal of 1 mm accuracy in station position, extremely wide bandwidths are required to allow the measurement of group delays with a precision of about a picosecond. In particular, VGOS demands the use of ultra-wideband receivers covering a broad frequency range from 2 GHz to 14 GHz (Petrachenko et al. 2009).
The officially used algorithm for calibrating the data from VGOS observations, found in Cappallo et al. 2014, is based on the use of pseudo-Stokes I (pI), a quantity obtained by combining the four linear-polarization correlation products. The main drawback of this method is that it does not properly account for instrumental and source-intrinsic polarimetry, which can cause errors in geodetic and astronomical products.
We have developed a calibration pipeline for VLBI interferometers that observe on a basis of linear polarization. We used the algorithm PolConvert (Martí-Vidal et al. 2024) to recompute the visibilities of a VGOS epoch in the basis of circular polarization by estimating the cross-polarization gains of all the antennas and using this information for the conversion (Martí-Vidal et al. 2016).
In addition to this, we implemented a wide-band global fringe-fitting algorithm (WBGFF) that accounts for dispersive effects. It subtracts an a priori model of the ionospheric dispersive delays by using IONEX maps and applies a novel approach for a fast estimate of dispersive and non-dispersive antenna-based delays and phases.
We tested this pipeline in the IVS experiment VO2187, observed on 6-7 July 2022, where eight antennas participated: Goddard (GS), Ishioka (IS), Kokee (K2), McDonald (MG), the twin Onsala telescopes (OE and OW), Westford (WF) and Yebes (YJ). The total recorded bandwidth was 1 GHz, divided into 32 spectral windows of 32 MHz each. The total bandwidth, ranging between 3 GHz and 11 GHz, is arranged in subsets of four bands, centered around 3.25, 5.5, 6.75, and 10.5 GHz, respectively, and labelled A, B, C, and D. A total of 74 radio-loud AGN were observed during an observing time of 24 hours in total.
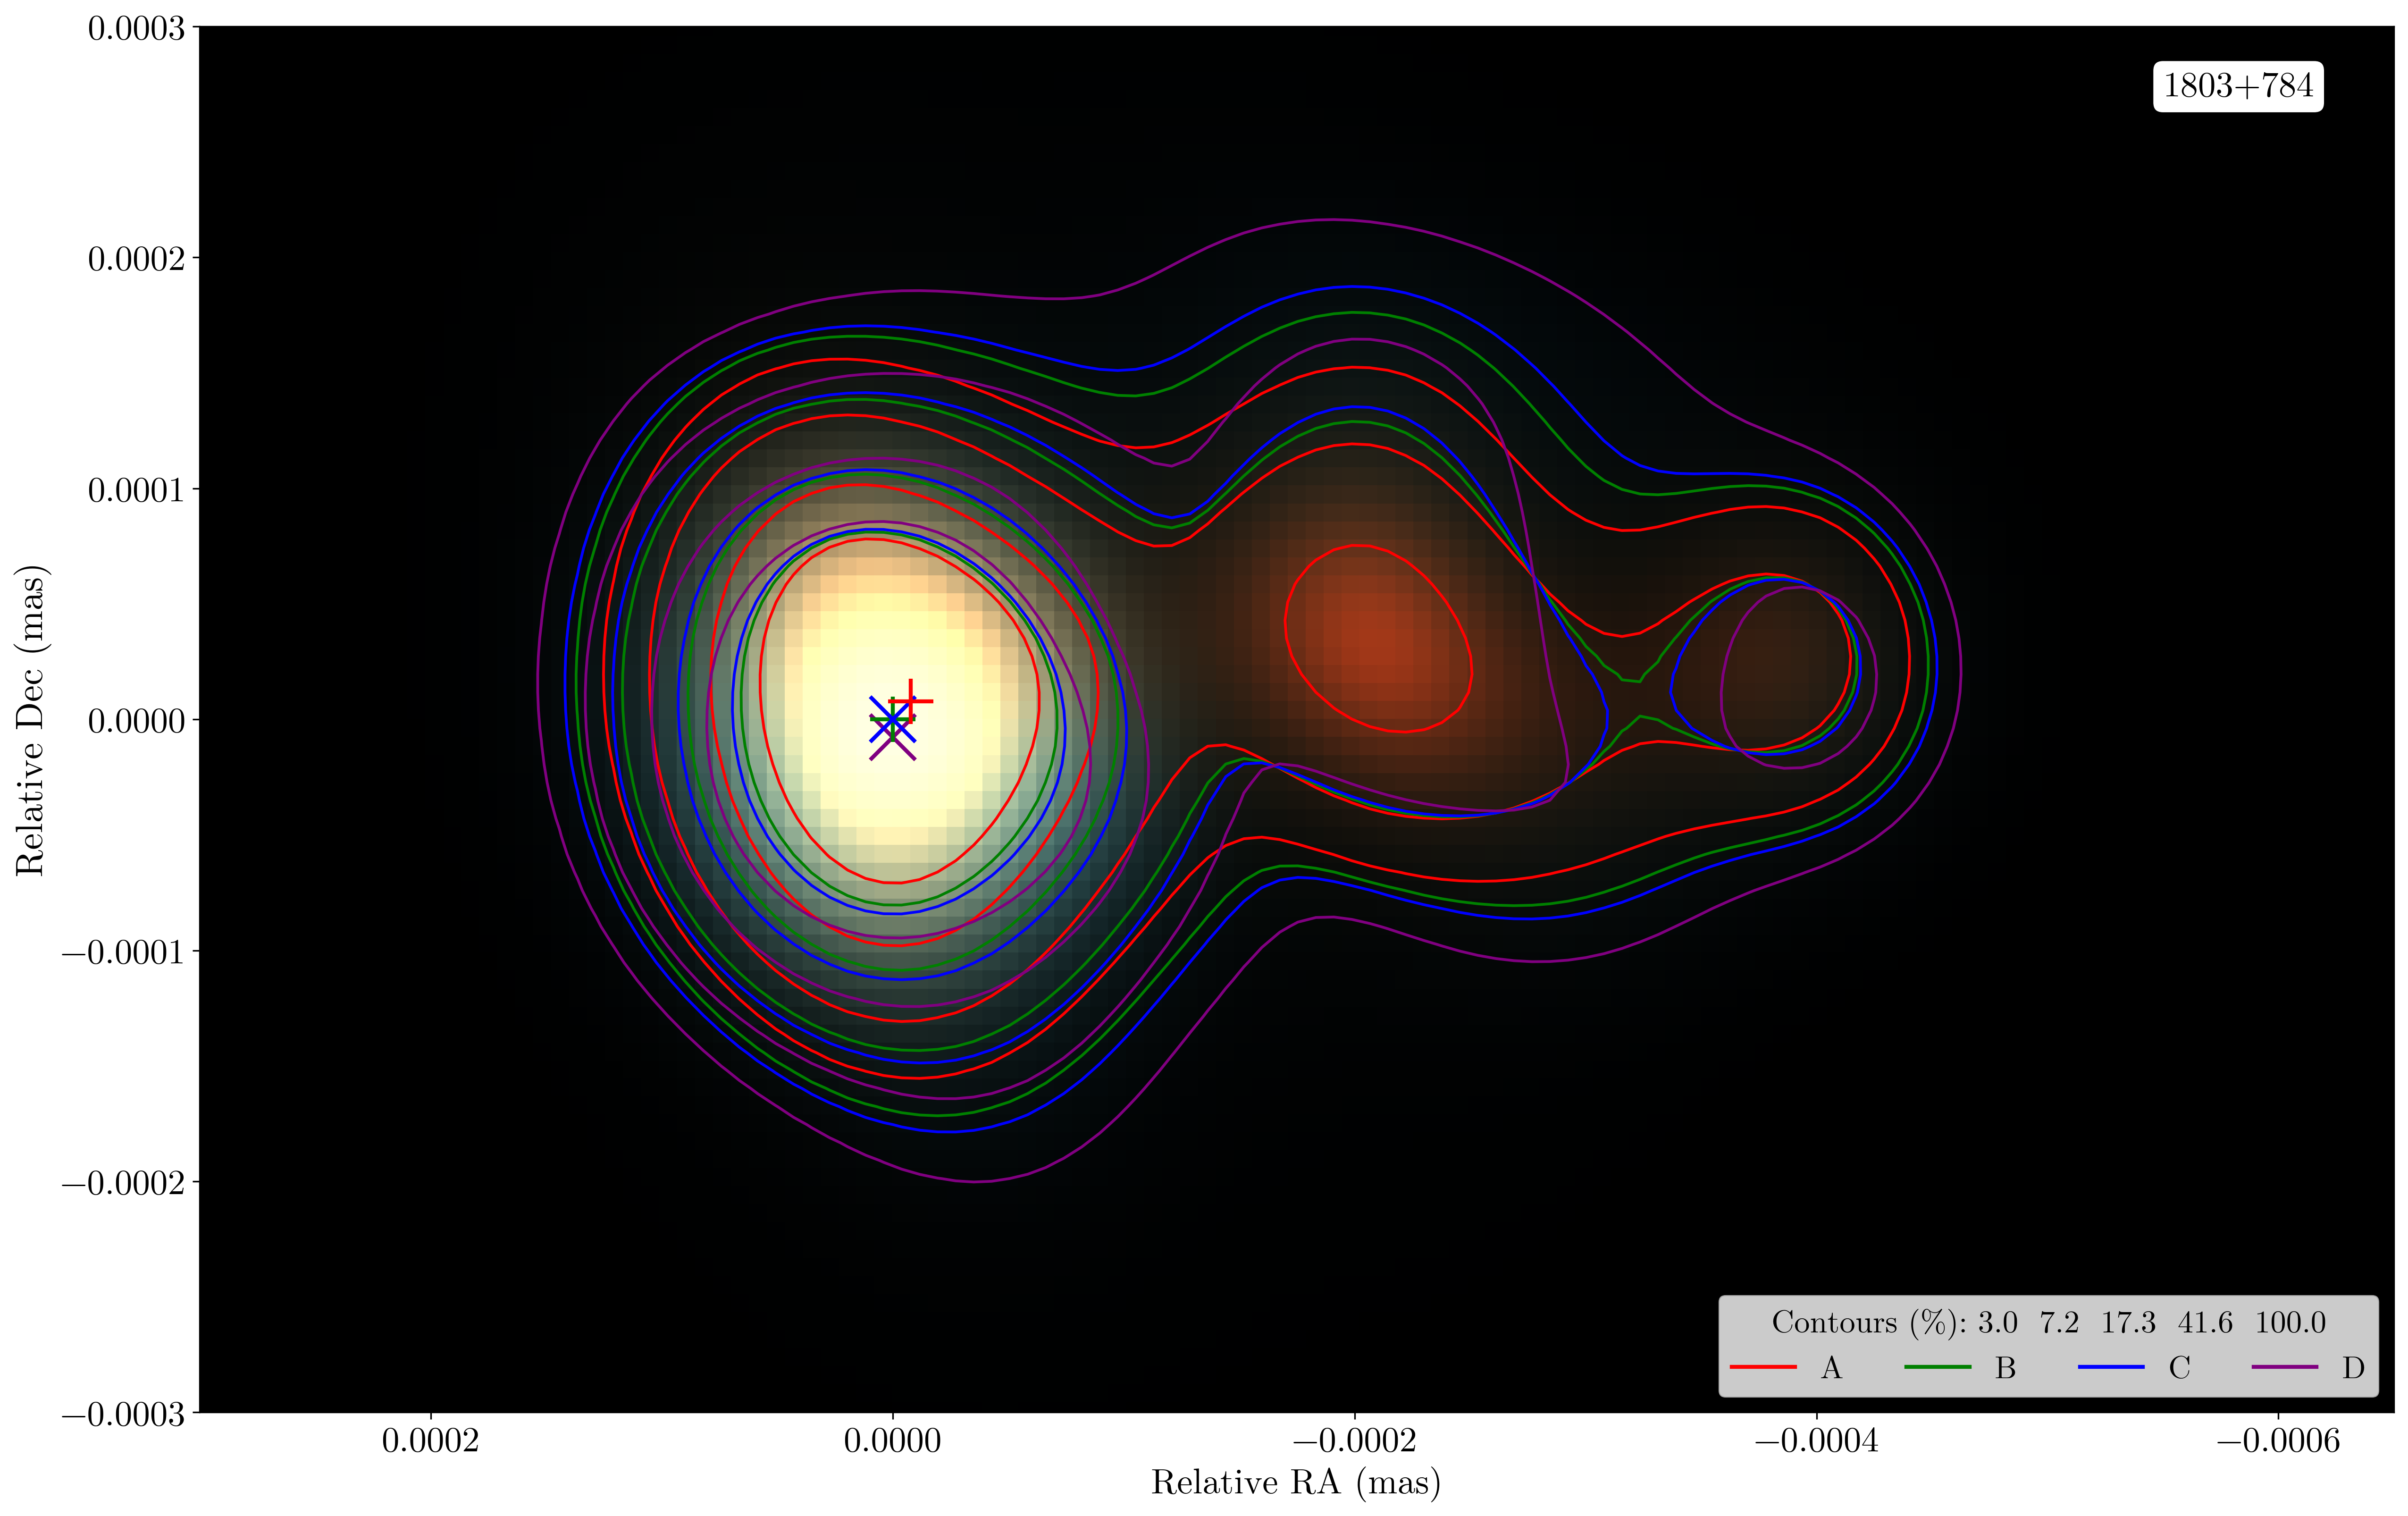
After applying our calibration pipeline, we applied an amplitude calibration based on an incomplete set of gain curves and system temperatures for some of the VGOS stations. Finally, we generated full-polarization wide-band images for the most frequently observed sources. An example is shown in Figure 1. We have obtained multifrequency Stokes I images with EHTim software, to which a multifrequency mode for imaging deconvolution was recently added (Chael et al. 2023). We have also obtained full-polarization images from the 1849+670 source with the CASA version of CLEAN, for the four VGOS bands (Figure 2). The images were obtained after a D-term calibration with the PolSolve software (Martí-Vidal et al. 2021). This is the first time that full-polarization and multifrequency images were obtained from sources observed with VGOS.

Figure 1. Total intensity multifrequency image of 1803+784 from VGOS experiment VO2187. The map is a false colour image, resembling the VGOS bandwidth to the optical range. The contours are shown at five levels of the peak percentage, specified in the legend. Each contour colour represents the map for the central frequency of each band: 3.25, 5.5, 6.75, and 10.5 GHz

Figure 2. CLEAN full-polarization images of 1849+670 for epoch VO2187, using all the VGOS bands. The FWHM of the convolving beams are shown in the bottom left corners. Contours are shown at five levels of peak percentage in logarithmic scale. The polarization intensity is shown in blue, EVPAs are shown in red, and the polarization peaks are marked as yellow crosses.
The products from this pipeline can provide valuable full-polarization astronomical information from the observed sources and potentially improve geodetic results. Furthermore, they can be used to potentially improve the geodetic results, since they allow us to minimize the negative effects of the source structure, as well as the misalignment of images in different bands.
These results have been published in the article entitled ‘Towards an astronomical use of new-generation geodetic observations. I. From the correlator to full-polarization images’ (Pérez-Díez et al. 2024, A&A, 688, A151).
References:
Petrachenko, B., Niell, A., Behrend, D., et al. 2009, Design Aspects of the VLBI2010 System. Progress Report of the IVS VLBI2010 Committee, June 2009, NASA/TM-2009-214180, 62
Cappallo, R. 2014, in International VLBI Service for Geodesy and Astrometry
2014 General Meeting Proceedings: “VGOS”: The New VLBI Network, 91
Chael, A., Issaoun, S., Pesce, D. W., et al. 2023, ApJ, 945, 40
Martí-Vidal, I., Roy, A., Conway, J., & Zensus, A. J. 2016, A&A, 587, A143
Martí-Vidal, I., Mus, A., Janssen, M., de Vicente, P., & González, J. 2021, A&A, 646, A52
Martí-Vidal, I., Crew, G. B., Reynolds, C., Marcote, B., & Kettenis, M. 2024,
https://github.com/marti-vidal-i/PolConvert/releases/tag/2.0.7
More information: Pérez-Díez, V. et al. 2024, A&A, 688, A151
Contact: Víctor Pérez-Díez, v.perez@oan.es