European VLBI Network observations of the peculiar radio source 4C 35.06 overlapping with a compact group of nine galaxies
Patrik Veres
To better understand how the galaxies form, it is crucial to observe them when they are evolving. The brightest cluster galaxies (BCGs) are thought to evolve into the most luminous and massive galaxies in the Universe through multiple merger events. These galaxies are located at the core of their galaxy cluster and are often radio-loud objects. The BCG at the core of the Abell 407 cluster (at a redshift of z=0.047) is a compact group of nine galaxies (an optical image of it is shown in Figure 1.), which is, to our knowledge, the most compact and richest system of galaxies known to date at similar redshifts. The nonet was first noticed by Fritz Zwicky in the 1970s (Zwicky & Zwicky 1971). Later, multi-wavelength studies of the system suggested undergoing BCG formation via slow major mergers, making the cluster an excellent laboratory for galaxy evolution studies (Schneider & Gunn 1982).
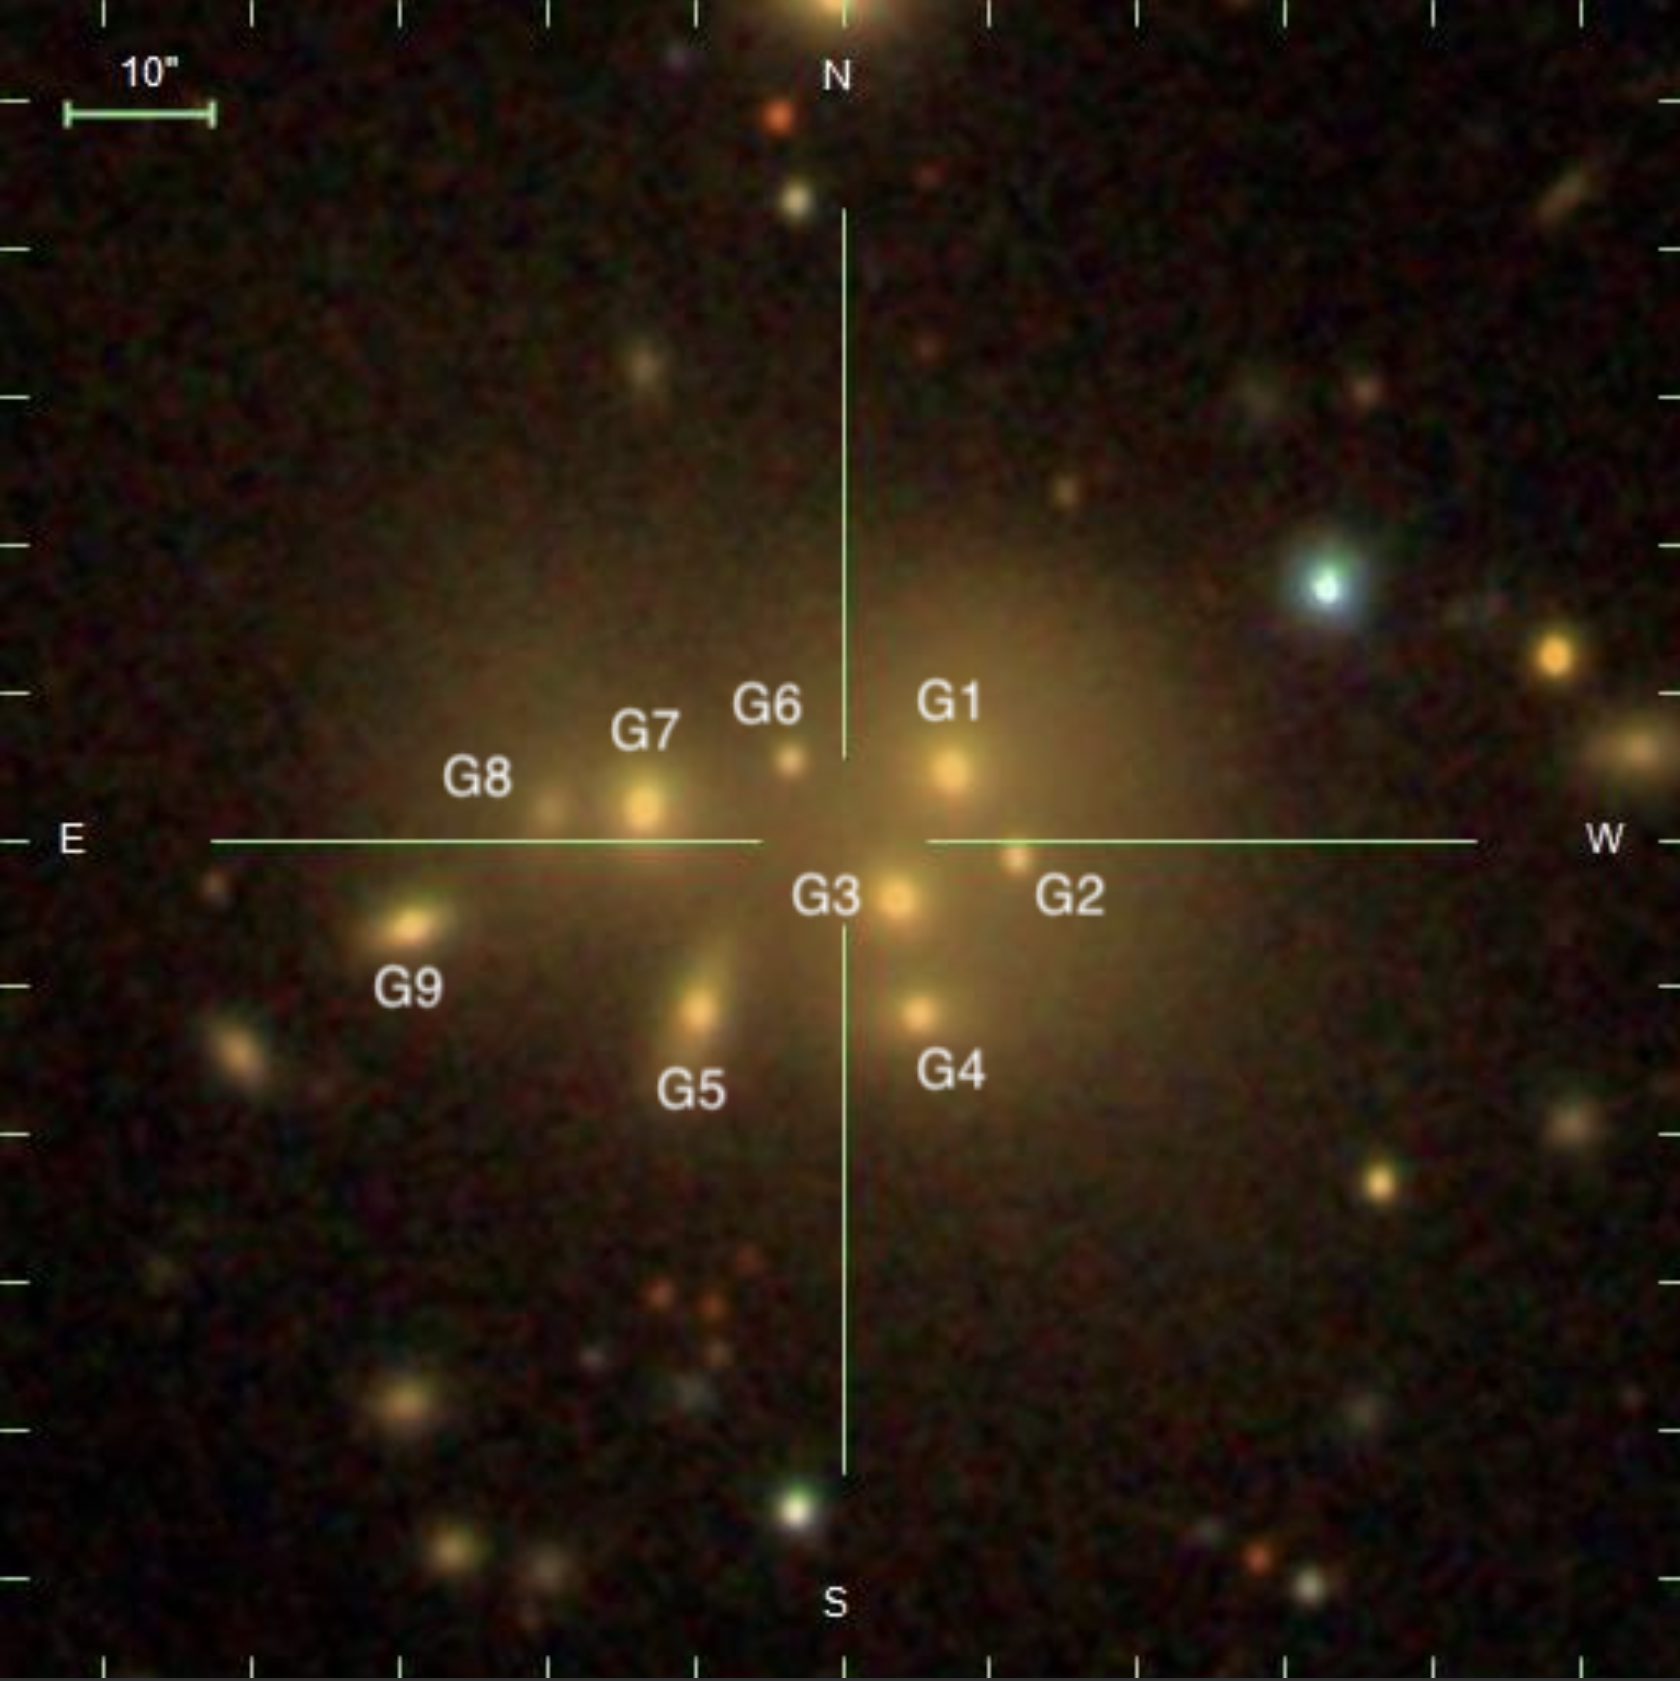
Figure 1: Sloan Digital Sky Survey (SDSS) optical image of the unique group of nine galaxies at the core of the galaxy cluster Abell 407.
Radio observations with the Very Large Array (VLA), the Low-Frequency Array (LOFAR) and the Giant Metrewave Radio Telescope (GMRT) revealed helically twisted jets and diffuse outer lobes, indicating gravitational perturbation caused by the nearby galaxies (Schuveski et al. 2015; Biju et al. 2017). The large-scale radio structure with inner and outer twin lobes and their spectral properties led Schuveski et al. (2015) to interpret the puzzling system with recurrent active galactic nucleus (AGN) activity (i.e., two subsequent episodes of jet activity).
However, these radio observations did not eventually identify the galaxy responsible for the large-scale radio emission. We conducted very long baseline interferometry (VLBI) observations with the European VLBI Network (EVN) and the Multi-Element Radio Linked Interferometer Network (e-MERLIN) in order to be able to identify the radio-loud AGN in question. We observed this unique system at 1.7 and 4.9 GHz frequencies in 2020, and requested multiple-phase-centre correlation at JIVE.
Two galaxies were detected above 6 times the local image noise level. These are the galaxies denoted by G1 and G3 in Figure 1. We detected G1 at 1.7 GHz (Figure 2.), while G3 at both frequencies (Figure 3.). The high estimated brightness temperature values imply that the radio emission of these galaxies is dominated by non-thermal processes powered by AGNs. Moreover, for G3, we were able to calculate the spectral index of the detected radio feature, which is further compatible with its AGN core classification.
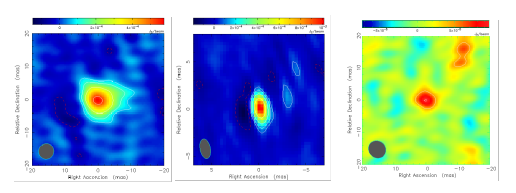
Figure 2: Naturally weighted 1.7 GHz (left) and 4.9 GHz (middle) radio maps of galaxy G3 and 1.7 GHz radio map of galaxy G1 (right).
Our results confirm the presence of an AGN in G3 as was earlier suggested by Liuzzo et al. (2010). The other radio-loud AGN detected (G1), however, sheds a new light on the nature of the nonet. The large-scale double-double morphology (Figure 4.) might be due to the jet activities of two different radio-loud AGNs in the system. In this scenario, the AGN in G1 was active in the past and is responsible for the steep-spectrum and consequently older outer lobes, whilst G3 is associated with the young flatter-spectrum inner lobes. At the distance between these two galaxies (~9 kpc), AGN activity can play an important role in galaxy evolution (e.g., Travascio et al. 2020). Further studies of this exciting galaxy group will reveal more details about its ongoing galaxy formation.
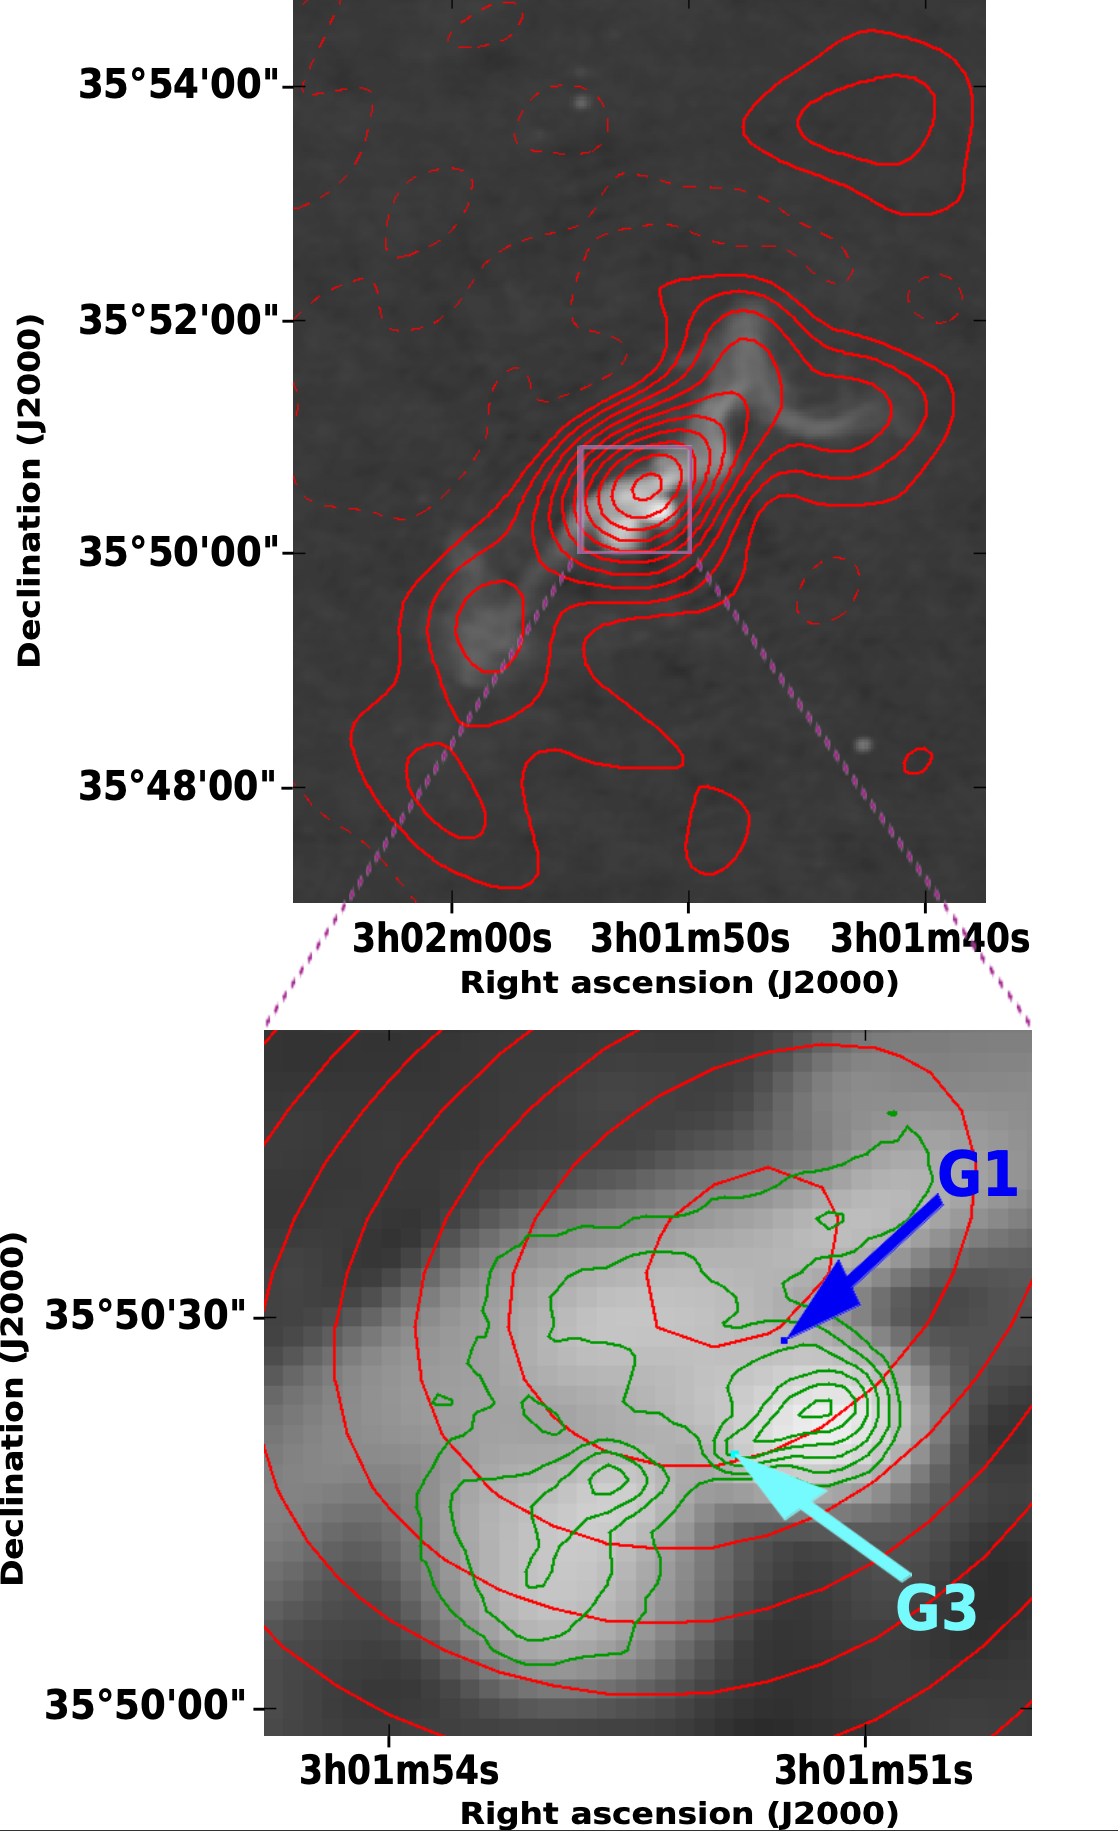
Figure 3: Overlay maps of archival radio data showing the large-scale double-double radio morphology of the system. Upper panel: 610 MHz GMRT observations (Biju et al. 2017) shown with the greyscale map while the red contours show the 62 MHz LOFAR detection (Schuveski et al. 2015). Bottom panel: Zoomed-in view of the central region. The green contours represent the most recent VLASS observations. The dark blue and light blue arrows indicate the VLBI positions of galaxies G1 and G3, respectively.
References:
Biju, K. G., Bagchi, J., Ishwara-Chandra, C. H., et al. 2017, MNRAS, 471, 617
Liuzzo, E., Giovannini, G., Giroletti, M., & Taylor, G. B. 2010, A&A, 516, A1
Schneider, D. P. & Gunn, J. E. 1982, ApJ, 263, 14
Shulevski, A., Morganti, R., Barthel, P. D., et al. 2015, A&A, 579, A27
Travascio, A., Bongiorno, A., Tozzi, P., et al. 2020, MNRAS, 498, 2719
Zwicky, F. & Zwicky, M. A. 1971, Catalogue of selected compact galaxies and of post-eruptive galaxies
More information: P. M. Veres et al. Astronomy & Astrophysics, Volume 684, id.A188, 7 pp.
Contact: veres@astro.ruhr-uni-bochum.de